

The new Census Equal Employment Opportunity Tabulation that Provides a Profile of America’s Workforce data came out today. This basically tells us about our nation’s employment data by race, gender, industry, occupation and income. For us data nerds this is a bucket full of awesome because it offers a snap shot of our great nation. Some of the findings were that:
- Women make up for 47.2% of the workforce. That is the highest percentage ever!
- “In the latest tabulation, non-Hispanic whites made up 67 percent of the labor force in 2006-2010, followed by Hispanics at 15 percent, non-Hispanic blacks at 11 percent and non-Hispanic Asians at 5 percent.”
- “Personal care aide was the fastest-growing occupation among non-Hispanic whites, non-Hispanic blacks, Hispanics and non-Hispanic Asians.”
- Approximately 14,545,110 Black Americans are employed in the United States.
- 6,616,825 were Black males (4.8%)
- 7,928,285 are Black females (5.7%).
- There are 377,735 Black American Nursing, psychiatric and home health aides in the United States.
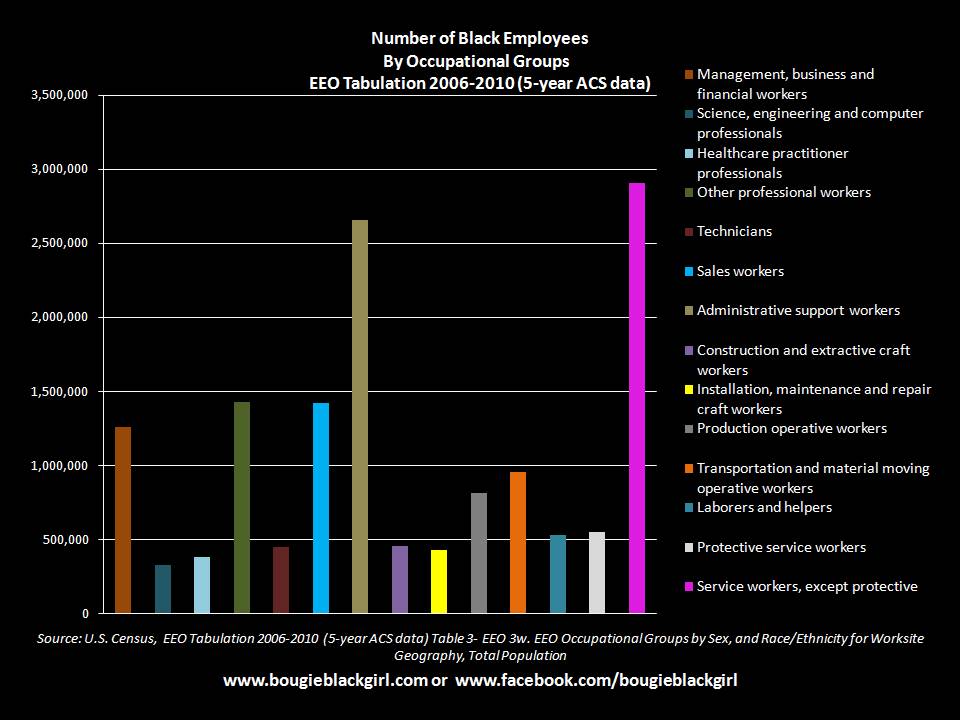
- Approximately 2.9 million Black Americans work in service occupations. Black Americans are 15.3% of all service employees in the United States.
- Only 5.8% of the total number of people in the Science, engineering and computer professionals occupations are Black Americans (325,820) and only 3.8% are Black males.
- Protective Service occupations have the highest percentage of Black Americans at 18.2% (547,525).
- Only 0.2% (16,320) of people in the construction occupations are Black female.
- Over 1.2 million of all of the employees who are Management, business and financial workers are Black American (7.2%). That is higher than every other minority group.
| Occupation | Black Male | Black Female | Percentage Black Americans in the Occupation |
| Management, business and financial workers | 3.2% | 4.0% | 7.2% |
| Science, engineering and computer professionals | 3.8% | 2.0% | 5.8% |
| Healthcare practitioner professionals | 1.4% | 6.4% | 7.8% |
| Other professional workers | 3.1% | 6.1% | 9.2% |
| Technicians | 3.5% | 7.7% | 11.2% |
| Sales workers | 3.5% | 5.6% | 9.2% |
| Administrative support workers | 3.5% | 8.9% | 12.4% |
| Construction and extractive craft workers | 5.6% | 0.2% | 5.8% |
| Installation, maintenance and repair craft workers | 6.6% | 0.8% | 7.4% |
| Production operative workers | 7.5% | 4.5% | 12.0% |
| Transportation and material moving operative workers | 12.3% | 3.1% | 15.4% |
| Laborers and helpers | 7.5% | 4.5% | 11.9% |
| Protective service workers | 12.1% | 6.1% | 18.2% |
| Service workers, except protective | 5.0% | 10.3% | 15.3% |
On table EEO 11w. Detailed Census Occupation by Earnings, Sex, and Race/Ethnicity for Worksite Geography, Total Population of civilians who are employed at work and who are 16 years and over found that:
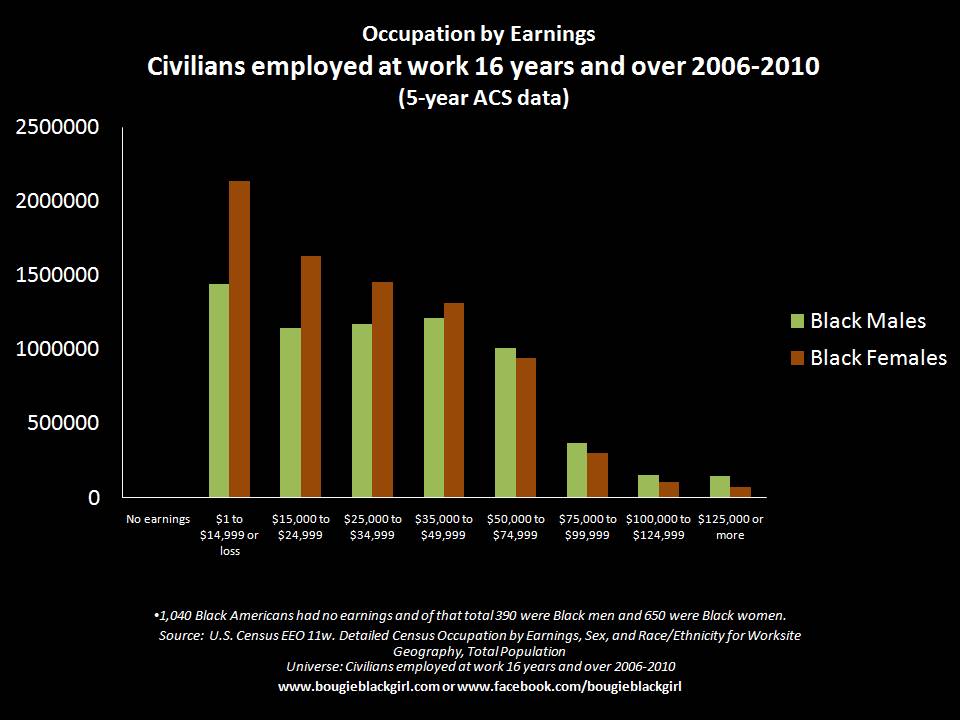
- Only 1,040 Black Americans made zero earnings.
- Over 3.5 million Black Americans earn zero to $14,999.
- Over 6.5 million Black females and 4.9 million Black males earned zero to $49,999.
- Over 1.6 million Black males earned $50,000 and up while 1.4 million Black women earned $50,000 and up.
- 211,230 Black Americans earn $125,000 and more.
| Earnings | Black Males | Black Females |
| No earnings | 390 | 650 |
| $1 to $14,999 or loss | 1,438,000 | 2,135,945 |
| $15,000 to $24,999 | 1,139,395 | 1,626,255 |
| $25,000 to $34,999 | 1,168,705 | 1,450,625 |
| $35,000 to $49,999 | 1,210,575 | 1,309,695 |
| $50,000 to $74,999 | 1,009,435 | 939,275 |
| $75,000 to $99,999 | 363,685 | 295,035 |
| $100,000 to $124,999 | 146,455 | 99,770 |
| $125,000 or more | 140,185 | 71,045 |
More random facts:
- The highest number of Black federal workers works in service occupations (2,218,810) and they are 16% of all of the Federal service workers.
- Over 5.3 million Black Americans have some college or an associate’s degree.
- Only 1.5 million have not graduated from high school.
- Approximately, 2,086,355 have a bachelor’s degree, 788,735 have a master’s degree and 237,400 have a doctoral or professional degree.
For more information please go to Census.gov or just click here.
Source: U.S. Census Equal Employment Opportunity Tabulation 2006-2010 five year ACS data.